In the last installment of my “Understanding ETFs” series, we toured the U.S. equity ETF landscape, covering solutions you can use to diversify your portfolio’s domestic stock allocation. Of course, when it comes to investing, you don’t have to limit yourself to North America. Today, let’s head overseas, to explore how to further diversify your global portfolio by adding ETFs from other developed markets around the globe.
Before we get going: When I refer to “international” investing in this piece, I’m talking about investing in developed stock markets outside of North America. Since it would get pretty tedious if we used that entire phrase every time, this is the common short-hand for them in Canadian financial-speak. We’ll roll with that.
https://mapchart.net/world.html
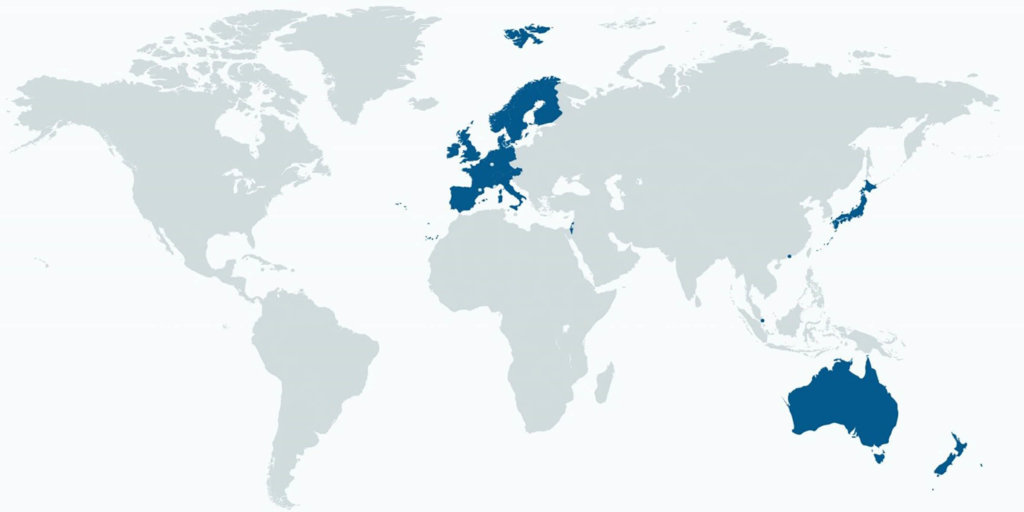
The Developed World at Our Financial Fingertips
In 2001, BlackRock released the iShares MSCI EAFE ETF (EFA). MSCI is an acronym for “Morgan Stanley Capital International,” while EAFE stands for “Europe, Australasia and the Far East”. EFA tracks the performance of over 900 large and mid-size companies located in 21 developed countries around the world, excluding Canada and the U.S.
EFA’s largest holdings include a number of familiar names most Canadians will instantly recognize.
Top 10 Holdings by EFA Weight
| Company |
Symbol |
Weight |
| Nestle SA |
NESN |
2.0% |
| Novartis AG |
NOVN |
1.5% |
| Roche Holding AG |
ROG |
1.4% |
| HSBC Holdings plc |
HSBA |
1.3% |
| Royal Dutch Shell plc Class A |
RDSA |
1.1% |
| Toyota Motor Corp. |
7203 |
1.1% |
| TOTAL SA |
FP |
1.0% |
| BP plc |
BP. |
1.0% |
| Royal Dutch Shell plc Class B |
RDSB |
0.9% |
| AIA Group Ltd. |
1299 |
0.8% |
Source: BlackRock Inc., as of December 31, 2018
As EFA trades in U.S. dollars on the U.S. stock exchange, Canadian investors may find it more convenient to purchase the BMO MSCI EAFE Index ETF (ZEA) instead. ZEA follows the same index, but trades in Canadian dollars on the Canadian stock exchange.
| U.S.-listed |
Canadian-Listed |
| iShares MSCI EAFE ETF (EFA) |
BMO MSCI EAFE Index ETF (ZEA) |
Each company in the MSCI EAFE Index is weighted according to its “float-adjusted” market capitalization. For more information on float-adjusted market caps, please watch my video, Understanding Canadian Equity ETFs.
It’s a Small World, After All
In 2007, BlackRock also launched the iShares MSCI EAFE Small-Cap ETF (SCZ). SCZ complements EFA by following the MSCI EAFE Small Cap Index, which tracks the performance of over 2,300 smaller companies located outside of North America.
| Tracking ETF |
Symbol |
MER |
Underlying Index |
Number of Stocks |
Dividend Yield |
| iShares MSCI EAFE ETF |
EFA |
0.32% |
MSCI EAFE Index |
920 |
3.7% |
| iShares MSCI EAFE Small-Cap ETF |
SCZ |
0.40% |
MSCI EAFE Small Cap Index |
2,348 |
2.9% |
Sources: BlackRock Inc., MSCI, as of December 31, 2018
By allocating about 85% of your international investment dollars to EFA, and the remaining 15% to SCZ, you gain float-adjusted market-cap exposure to most of the developed stocks outside of North America, at an annual MER of about 0.33%.
Everybody, Come Together
True to form for our clever index providers, there also is a single index that follows a combination of the MSCI EAFE Index and the MSCI EAFE Small Cap Index. It’s called the MSCI EAFE IMI Index.
“IMI” stands for “Investable Market Index”, which includes large, mid-size and small-size companies. This index follows the performance of over 3,200 international companies, providing broad stock market exposure.
You may now be thinking, “Say, I’ll bet there are ETFs available to invest in those MSCI EAFE IMI Index companies. That way, I can invest in one fund instead of two, and achieve the same goal.”
If you leaped to this conclusion ahead of me, congratulations! You’re not only correct, you’re clearly getting into the swing of my “Understanding ETFs” series.
For starters, the iShares Core MSCI EAFE ETF (IEFA) trades on the U.S. stock exchange in U.S. dollars. IEFA tracks over 3,200 international stocks and has a cost of 0.08% per year. In addition, its sister ETF, the iShares Core MSCI EAFE IMI Index ETF (XEF), trades on the Canadian stock exchange in Canadian dollars. XEF also tracks over 3,200 international stocks and has a cost of 0.22% per year.
| Tracking ETF |
Symbol |
MER |
Underlying Index |
Number of Stocks |
Dividend Yield |
| iShares Core MSCI EAFE ETF |
IEFA |
0.08% |
MSCI EAFE IMI Index |
3,268 |
3.6% |
| iShares Core MSCI EAFE IMI Index ETF |
XEF |
0.22% |
MSCI EAFE IMI Index |
3,268 |
3.6% |
Sources: BlackRock Asset Management Canada Limited, BlackRock Inc., MSCI as of December 31, 2018
IEFA is generally less tax-efficient than XEF when held in a TFSA, RESP, RDSP or taxable account. In most of these account types, the tax drag is due to the extra 15% U.S. withholding taxes that apply on foreign dividends paid to Canadian investors from this U.S. fund.
XEF, on the other hand, holds most of its underlying stocks directly in a Canadian-domiciled fund structure, so it avoids this second layer of U.S. foreign withholding taxes. For more information on foreign withholding taxes, please refer to our white paper on the subject, but here’s a quick view of their expected impact.
Estimated Unrecoverable Foreign Withholding Taxes: IEFA vs. XEF
| Account Type |
iShares Core MSCI EAFE ETF (IEFA) |
iShares Core MSCI EAFE IMI Index ETF (XEF) |
| Registered Retirement Savings Plan (RRSP)
Registered Retirement Income Fund (RRIF)
Locked-in Retirement Account (LIRA)
Locked-in Income Fund (LIF) |
0.28% |
0.30% |
| Tax-Free Savings Account (TFSA) |
0.76% |
0.30% |
| Registered Education Savings Plan (RESP) |
0.76% |
0.30% |
| Registered Disability Savings Plan (RDSP) |
0.76% |
0.30% |
| Taxable Accounts |
0.28% |
0.00% |
Sources: BlackRock Asset Management Canada Limited, BlackRock Inc., MSCI as of December 31, 2018
Room with a VIU
Unsurprisingly, where there’s success, there are copycats, which is all well and good for you, the consumer. In 2015, Vanguard Canada released the Vanguard FTSE Developed All Cap ex North America Index ETF (VIU), to compete with the tax-efficiency of XEF. VIU follows the FTSE Developed All Cap ex North America Index, which tracks the performance of over 3,600 companies located in 23 developed countries outside of North America, making it similar to IEFA and XEF. As discussed in earlier installments, “FTSE” stands for “Financial Times Stock Exchange,” and “All Cap” indicates that the index tracks large, mid-cap, and small-cap companies.
| Tracking ETF |
Symbol |
MER |
Underlying Index |
Number of Stocks |
Dividend Yield |
| Vanguard FTSE Developed All Cap ex North America Index ETF |
VIU |
0.23% |
FTSE Developed All Cap ex North America Index |
3,675 |
3.5% |
Sources: Vanguard Investments Canada Inc., FTSE Russell Indices as of December 31, 2018
Vanguard’s VIU fund has an MER of 0.23%, and holds most of the underlying stocks directly in a Canadian-domiciled fund structure. This structure makes VIU similar to XEF in tax-efficiency.
Estimated Unrecoverable Foreign Withholding Taxes: XEF vs. VIU
| Account Type |
iShares Core MSCI EAFE IMI Index ETF (XEF) |
Vanguard FTSE Developed All Cap ex North America Index ETF (VIU) |
| Registered Retirement Savings Plan (RRSP)
Registered Retirement Income Fund (RRIF)
Locked-in Retirement Account (LIRA)
Locked-in Income Fund (LIF) |
0.30% |
0.31% |
| Tax-Free Savings Account (TFSA) |
0.30% |
0.31% |
| Registered Education Savings Plan (RESP) |
0.30% |
0.31% |
| Registered Disability Savings Plan (RDSP) |
0.30% |
0.31% |
| Taxable Accounts |
0.00% |
0.00% |
Sources: BlackRock Asset Management Canada Limited, BlackRock Inc., FTSE Russell Indices, MSCI, Vanguard Investments Canada Inc. as of December 31, 2018
Where in the World Is Korea?
The main difference between the FTSE Developed All Cap ex North America Index and the MSCI EAFE IMI Index, is that FTSE considers Korea to be a developed country, while MSCI considers it to still be an emerging market (the same is true of Poland, but it has much less of an impact due to its smaller world market capitalization). This means that VIU (which follows the FTSE index) tracks more than 400 additional Korean companies than XEF (which follows the MSCI index).
Developed Markets Classification
| Country |
MSCI |
FTSE |
| Korea |
Emerging |
Developed |
| Poland |
Emerging |
Developed |
Thus, the large difference in the number of companies each index tracks. In fact, VIU currently allocates approximately 5% of its holdings to Korean stocks, while in turn underweighting many of its other top country holdings.
Top Country Weights: XEF vs. VIU
| Country |
VIU |
XEF |
Difference |
| Japan |
24.7% |
25.3% |
-0.6% |
| United Kingdom |
16.3% |
17.4% |
-1.1% |
| France |
9.0% |
9.9% |
-0.9% |
| Germany |
7.9% |
8.3% |
-0.4% |
| Switzerland |
7.6% |
8.0% |
-0.4% |
| Australia |
6.7% |
6.9% |
-0.2% |
| Korea |
5.0% |
– |
+5.0% |
| Hong Kong |
3.7% |
3.6% |
+0.1% |
| Netherlands |
3.1% |
3.3% |
-0.2% |
| Sweden |
2.7% |
3.1% |
-0.4% |
| Spain |
2.8% |
3.0% |
-0.2% |
Sources: BlackRock Asset Management Canada Limited, Vanguard Investments Canada Inc.as of December 31, 2018
Since 2003, the FTSE Developed All Cap ex North America Index has returned 6.6% in Canadian dollars on an annualized basis, while the MSCI EAFE IMI Index returned 6.1%.
Growth of $1: FTSE Developed All Cap ex North America Index (net div.) vs. MSCI EAFE IMI Index (net div.)
January 1, 2003 to December 31, 2018
Source: DFA Returns, Morningstar Direct as of December 31, 2018
The difference in returns can largely be attributed to the exclusion of Korean stocks in the MSCI EAFE IMI Index. Over the same time period, Korean stocks returned 8.8%, which was higher than the returns of all the international countries with larger market caps.
Annualized Country Returns: January 1, 2003 to December 31, 2018
| Country |
Annualized Return (in CAD) |
| Japanese Stocks |
5.0% |
| U.K. Stocks |
5.3% |
| France Stocks |
5.9% |
| German Stocks |
7.7% |
| Swiss Stocks |
7.5% |
| Australian Stocks |
8.6% |
| Korean Stocks |
8.8% |
Sources: MSCI, DFA Returns as of December 31, 2018
To Be Continued …
If you prefer XEF to VIU, but want to ensure that your portfolio includes Korean stocks within your emerging markets allocation, please subscribe and tune into our next video, “Understanding Emerging Markets Equity ETFs,” to learn more.
| Tracking ETF |
Symbol |
MER |
Underlying Index |
Number of Stocks |
Dividend Yield |
| iShares Core MSCI EAFE ETF |
IEFA |
0.08% |
MSCI EAFE IMI Index |
3,268 |
3.6% |
| iShares Core MSCI EAFE IMI Index ETF |
XEF |
0.22% |
MSCI EAFE IMI Index |
3,268 |
3.6% |
| Vanguard FTSE Developed All Cap ex North America Index ETF |
VIU |
0.23% |
FTSE Developed All Cap ex North America Index |
3,675 |
3.5% |
Sources: BlackRock Asset Management Canada Limited, BlackRock Inc., FTSE Russell Indices, MSCI, Vanguard Investments Canada Inc.as of December 31, 2018