This blog post is adapted from my French column with the newspaper Les Affaires.
How about an RRSP portfolio that seldom loses money and has chalked up an annualized return of over 8% since 1988 and 5.7% over the past 10 years (2007-2016)? The portfolio is in no way built on byzantine strategies and only needs to be adjusted (rebalanced) once a year. On top of all that, it isn’t even designed to maximize returns. Instead, it’s aimed at capturing market returns while remaining as diversified as possible, so as to eliminate the risks of focusing on a specific holding, country or sector. Too good to be true? It’s possible with index exchange traded funds (ETFs).
Building blocks
Our portfolio necessarily includes equities and bonds — the former to achieve return, the latter to control volatility. We’ll opt for the most common distribution: 60% in equities and 40% in bonds. Let’s take care of bonds right off: we’ll give the nod to an ETF that mirrors the overall Canadian bond market. We’ve picked the BMO product, but other providers offer ETFs that are just as valid.
As for equities, we’ll invest equal thirds in Canadian, U.S. and international stocks. About three-quarters of international equities market capitalization is concentrated in developed economies (Great Britain, Japan, France, Australia, etc.), with the remaining quarter in emerging economies (China, South Korea, Russia, etc.). We’ll keep the same proportions.
Portfolio
For the most part, we’ve chosen ETFs that are simple and diversified (a large number of holdings), with low expenses (total of 0.15%). On top of this, each ETF has to faithfully replicate its benchmark index return. We’ve also limited ourselves to ETFs traded in Canadian dollars, to avoid currency conversion fees. Here is the resulting portfolio:
| HOLDING |
TICKER |
MGMT. EXPENSE RATIO |
WEIGHT |
NUMBER OF HOLDINGS |
BENCHMARK INDEX |
Bonds
BMO Aggregate Bond Index |
ZAG |
0.14% |
40% |
800 |
FTSE TMX Canada Universe Bond |
| TOTAL BONDS |
|
|
40% |
|
|
Canadian equities
iShares Core S&P/TSX Capped Composite |
XIC |
0.06% |
20% |
250 |
S&P/TSX Capped Composite |
U.S. equities
Vanguard U.S. Total Market Index |
VUN |
0.16% |
20% |
3,600 |
CRSP U.S. Total Market |
International equities
iShares Core MSCI EAFE IMI |
XEF |
0.22% |
15% |
2,487 |
MSCI EAEO Investable Market |
| FINB BMO MSCI Emerging Markets |
ZEM |
0.29% |
5% |
491 |
MSCI Emerging Markets |
| TOTAL EQUITIES |
|
|
60% |
|
|
| TOTAL PORTFOLIO |
|
0.15% |
100% |
7,628 |
|
Sources: iShares, BMO and Vanguard
Note: These ETFs are appropriate in an RRSP context. For any other situation, speak to your financial advisor.
Portfolio risk
What makes this appealing is that, as you can see, it’s possible to build a simple, easily maintained portfolio that does what it is supposed to do, without inflicting too many major ups and downs on its owner. Our diversified portfolio includes over 7,600 holdings, and covers 45 countries and all sectors. The following chart shows the annual returns of a simulated portfolio made up of the indices closest to the ETFs in our model portfolio, with returns reduced by 0.50% to allow for management fees, transaction costs and any other expenses.
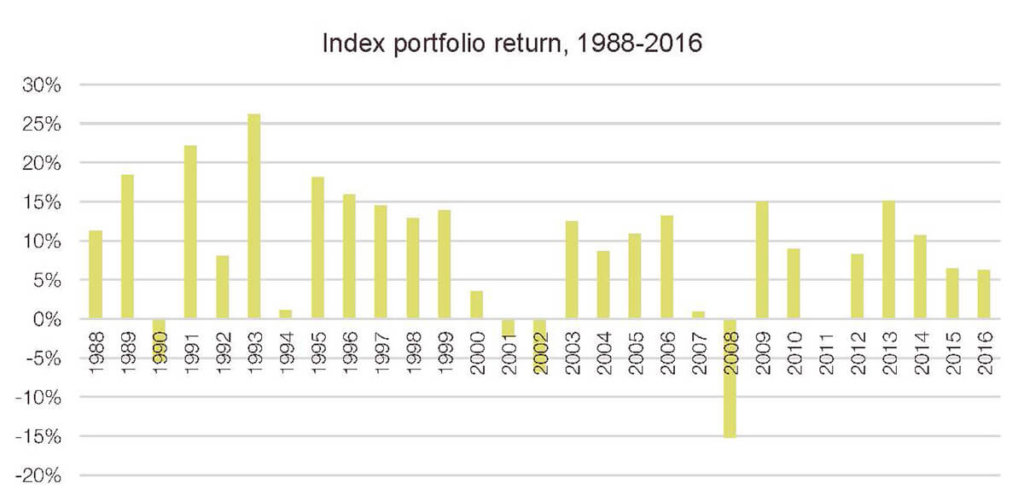
Source: Morningstar Direct
Note: The above returns have been simulated based on the following indices: 40% FTSE TMX Canada Universe Bond, 20% S&P/TSX Capped Composite, 20% Russell 3000 in CAD$, 15% MSCI EAFE in CAD$, 5% MSCI Emerging Markets in CAD$. All of the returns have been reduced by 0.50% per year to allow for expenses. The portfolio is rebalanced according to the target weights as at December 31 each year.
The most remarkable thing about this simulated portfolio is that it has lost money only four times in 29 years, and only once in seven years, in 1990, 2001, 2002 and 2008. The worst return was 15 %, during the 2008 financial crisis. You may object that 1988 to 2016 was a very positive period, and that returns may well be lower in the future, and I think you’re probably right. Indeed, returns have been more modest since 2000.
Conclusion
In the future, a globally diversified ETF portfolio may make money less often than six years out of seven. It is still plausible, however, that it will continue to be profitable most of the time. And we haven’t even tried to build a portfolio that minimizes losses or maximizes returns, focusing instead on participating in equity and bond markets while controlling risks and expenses. Surprising, don’t you think?