This blog post is adapted from my French column with the newspaper Les Affaires.
The Economy
2017 was a standout year, with accelerating global growth and positive returns in the equities and fixed-income markets. Global GDP picked up speed, advancing from average growth of 2.5% in recent years to 3.0%. The unemployment rate continued its downward trend in most developed countries.
In the U.S., 2017 was notable for the Federal Reserve’s three 0.25% federal funds rate hikes in March, June and December, as the U.S. economy is running at full capacity and has less need for monetary policy to bolster growth. Upwards of 2 million jobs were created in 2017.
Canada outperformed most developed countries with GDP growth of 3.4%, in part due to the strength of the energy sector. The Canadian economy created close to 400,000 new full-time jobs over one year and retail sales gained 6.2%. This excellent economic performance prompted the Bank of Canada to raise its policy interest rate by 0.50% during the summer.
The most attention-grabbing phenomenon in 2017 was bitcoin’s meteoric rise. It is worth 15 times its value one year ago. Due to its extreme volatility and the fact that this cryptocurrency’s underlying blockchain technology is so new and its environment is unregulated, we believe that bitcoin is a highly speculative asset and potentially dangerous to hold as an investment at this time.
The Markets
In my June column, I proposed a simple ETF portfolio that does an excellent job covering the five most important asset classes: Canadian bonds, Canadian equities, U.S. equities, equities of developed countries excluding North America, and emerging markets equities. This portfolio made money 25 years out of 29 from 1988 to 2016i. What about 2017? Drum roll please.
- BMO Aggregate Bonds delivered returns of 2.3%, which is only 0.2% below its benchmark index.
- Canadian equities: iShares Core S&P/TSX Capped Composite posted returns of 9.1%, nearly equal to its benchmark index.
- U.S. equities: Vanguard U.S. Total Market delivered returns of 13.0%, or 0.4% below the index.
- Equities from developed markets excluding North America: iShares Core EAFE IMI produced returns of 17.7%, less than 0.2% below its benchmark.
- Emerging markets equities: BMO MSCI Emerging Markets delivered a generous return of 28.9%, which was more than 1.0% above the benchmark index.
- The portfolio as a whole completed the year with a return of 9.6%, very close to the historical annual average of 9.2% recorded between 1988 and 2017. Nevertheless, this performance is high in relation to the average since 2000 of only 6.3%. Consequently, 2017 was a banner year for our passive ETF portfolio.
The experience of 2017 confirms for me that you do not need to outsmart the market to do well with your investment portfolio. The best strategy is to capture the returns it offers. It is better to treat the market like a friend than like an enemy that you have to beat. Note that we did not generate returns from this portfolio by abandoning caution. Quite the opposite. Forty percent of the capital is invested in bonds, which provides a degree of stability. However, do not believe that there is no risk involved. In a bear market, losses will be unavoidable for a period of time, and that will not be easy to tolerate. But, over the long term, a balanced and globally diversified index ETF portfolio will deliver more highs than lows and will help you reach your financial goals. Isn’t that what you want?
ETF Portfolio Returns in 2017
| SECURITY |
STOCK EXCHANGE SYMBOL |
BENCHMARK INDEX |
WEIGHTING |
RETURN IN 2017 |
| Bonds |
|
|
|
|
| BMO Aggregate Bond Index |
ZAG |
FTSE TMX Canadian Universe Bond |
40% |
2.3% |
| TOTAL BONDS |
|
|
40% |
|
|
|
|
|
|
| Canadian equities |
|
|
|
|
| iShares Core S&P/TSX Capped Composite |
XIC |
S&P/TSX Capped Composite |
20% |
9.1% |
| U.S. equities |
|
|
|
|
| Vanguard U.S. Total Market Index |
VUN |
CRSP U.S. Total Market |
20% |
13.0% |
| International equities |
|
|
|
|
| iShares Core MSCI EAFE IMI |
XEF |
MSCI EAEO Investable Market |
15% |
17.7% |
| BMO MSCI Emerging Markets |
ZEM |
MSCI Emerging Markets |
5% |
28.9% |
| TOTAL EQUITIES |
|
|
60% |
|
| TOTAL PORTFOLIO |
|
|
100% |
9.6% |
Source: Morningstar Direct
Index Portfolio Returns 1988–2017
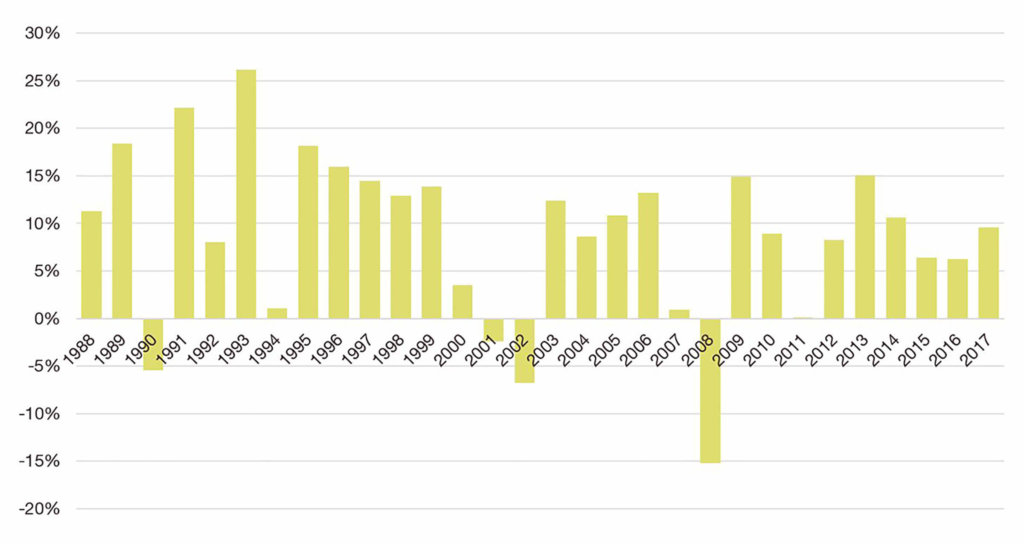
Source: Morningstar Direct
i Since most of the ETFs in the portfolio have only been trading for a few years, this statistic is based on the returns of the benchmark indexes, which have been reduced by 0.50% to reflect tracking errors. Nevertheless, the 2017 data are from the actual ETF portfolio.