Team Bender, Bender & Bortolotti – Model Portfolio – September 2023

This document provides the performance data for the Model ETF Portfolios as of September 2023, as compiled by the team.

For illustration purposes only. Actual client portfolios may be different.  

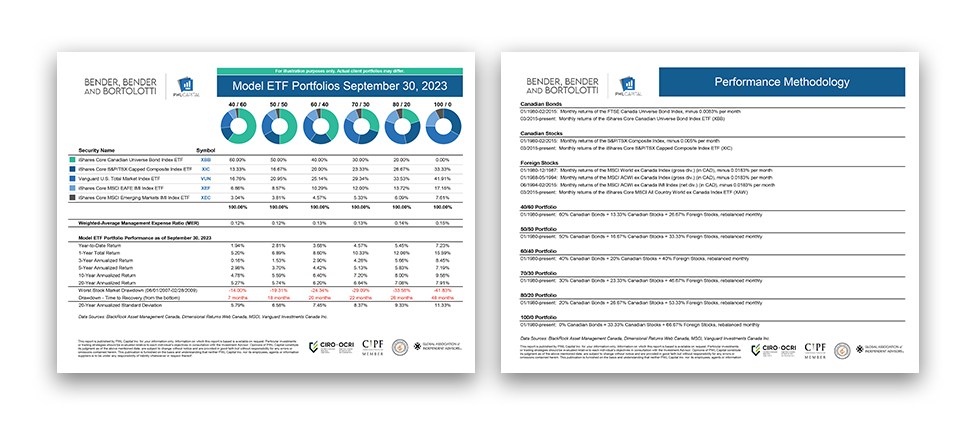
The PWL Model Portfolios have relatively short track records. However, they often track indexes with a longer history, so whenever fund returns were not available, we used the underlying index returns and subtracted the current management expense ratio of the fund. In a number of cases, we have had to approximate the returns of the asset classes using other indexes. All returns are in Canadian dollars and the portfolios are rebalanced annually.
Past performance does not guarantee future results. The historical performance of indexes is illustrative only and is not necessarily a reflection of the future performance of any fund tracking that benchmark.
    • Model ETF Portfolio Performance
      40% bonds - 60% stocks
      YTD Return 1.94%
      1-Year Total Return 5.20%
      3-Year Annualized Return 0.16%
      5-Year Annualized Return 2.98%
      10-Year Annualized Return 4.78%
      20-Year Annualized Return 5.27%
      Worst Stock Market Drawdown (06/01/2007-02/28/2009) -14.00%
      Drawdown - Time to Recovery (from the bottom) 7 months
      20-Year Annualized Standard Deviation 5.79%
    • Security Name
      40% bonds - 60% stocks
      iShares Core Canadian Universe Bond Index ETF 60.00%
      iShares Core S&P/TSX Capped Composite Index ETF 13.33%
      Vanguard U.S. Total Market Index ETF 16.76%
      iShares Core MSCI EAFE IMI Index ETF 6.86%
      iShares Core MSCI Emerging Markets IMI Index ETF 3.04%
      Management Expense Ratio (MER) 0.12%
    • Model ETF Portfolio Performance
      50% bonds - 50% stocks
      YTD Return 2.81%
      1-Year Total Return 6.89%
      3-Year Annualized Return 1.53%
      5-Year Annualized Return 3.70%
      10-Year Annualized Return 5.59%
      20-Year Annualized Return 5.74%
      Worst Stock Market Drawdown (06/01/2007-02/28/2009) -19.31%
      Drawdown - Time to Recovery (from the bottom) 18 months
      20-Year Annualized Standard Deviation 6.58%
    • Security Name
      50% bonds - 50% stocks
      iShares Core Canadian Universe Bond Index ETF 50.00%
      iShares Core S&P/TSX Capped Composite Index ETF 16.67%
      Vanguard U.S. Total Market Index ETF 20.95%
      iShares Core MSCI EAFE IMI Index ETF 8.57%
      iShares Core MSCI Emerging Markets IMI Index ETF 3.81%
      Management Expense Ratio (MER) 0.12%
    • Model ETF Portfolio Performance
      60% bonds - 40% stocks
      YTD Return 3.68%
      1-Year Total Return 8.60%
      3-Year Annualized Return 2.90%
      5-Year Annualized Return 4.42%
      10-Year Annualized Return 6.40%
      20-Year Annualized Return 6.20%
      Worst Stock Market Drawdown (06/01/2007-02/28/2009) -24.34%
      Drawdown - Time to Recovery (from the bottom) 20 months
      20-Year Annualized Standard Deviation 7.45%
    • Security Name
      60% bonds - 40% stocks
      iShares Core Canadian Universe Bond Index ETF 40.00%
      iShares Core S&P/TSX Capped Composite Index ETF 20.00%
      Vanguard U.S. Total Market Index ETF 25.14%
      iShares Core MSCI EAFE IMI Index ETF 10.29%
      iShares Core MSCI Emerging Markets IMI Index ETF 4.57%
      Management Expense Ratio (MER) 0.13%
    • Model ETF Portfolio Performance
      70% bonds - 30% stocks
      YTD Return 4.57%
      1-Year Total Return 10.33%
      3-Year Annualized Return 4.28%
      5-Year Annualized Return 5.13%
      10-Year Annualized Return 7.20%
      20-Year Annualized Return 6.64%
      Worst Stock Market Drawdown (06/01/2007-02/28/2009) -29.09%
      Drawdown - Time to Recovery (from the bottom) 22 months
      20-Year Annualized Standard Deviation 8.37%
    • Security Name
      70% bonds - 30% stocks
      iShares Core Canadian Universe Bond Index ETF 30.00%
      iShares Core S&P/TSX Capped Composite Index ETF 23.33%
      Vanguard U.S. Total Market Index ETF 29.34%
      iShares Core MSCI EAFE IMI Index ETF 12.00%
      iShares Core MSCI Emerging Markets IMI Index ETF 5.33%
      Management Expense Ratio (MER) 0.13%
    • Model ETF Portfolio Performance
      80% bonds - 20% stocks
      YTD Return 5.45%
      1-Year Total Return 12.06%
      3-Year Annualized Return 5.66%
      5-Year Annualized Return 5.83%
      10-Year Annualized Return 8.00%
      20-Year Annualized Return 7.08%
      Worst Stock Market Drawdown (06/01/2007-02/28/2009) -33.58%
      Drawdown - Time to Recovery (from the bottom) 26 months
      20-Year Annualized Standard Deviation 9.33%
    • Security Name
      80% bonds - 20% stocks
      iShares Core Canadian Universe Bond Index ETF 20.00%
      iShares Core S&P/TSX Capped Composite Index ETF 26.67%
      Vanguard U.S. Total Market Index ETF 33.53%
      iShares Core MSCI EAFE IMI Index ETF 13.72%
      iShares Core MSCI Emerging Markets IMI Index ETF 6.09%
      Management Expense Ratio (MER) 0.14%
    • Model ETF Portfolio Performance
      100% stocks
      YTD Return 7.23%
      1-Year Total Return 15.59%
      3-Year Annualized Return 8.45%
      5-Year Annualized Return 7.19%
      10-Year Annualized Return 9.58%
      20-Year Annualized Return 7.91%
      Worst Stock Market Drawdown (06/01/2007-02/28/2009) -41.83%
      Drawdown - Time to Recovery (from the bottom) 48 months
      20-Year Annualized Standard Deviation 11.33%
    • Security Name
      100% stocks
      iShares Core Canadian Universe Bond Index ETF 0.00%
      iShares Core S&P/TSX Capped Composite Index ETF 33.33%
      Vanguard U.S. Total Market Index ETF 41.91%
      iShares Core MSCI EAFE IMI Index ETF 17.15%
      iShares Core MSCI Emerging Markets IMI Index ETF 7.61%
      Management Expense Ratio (MER) 0.15%