PWL Toronto – Market Statistics (September 2020)

All figures in CAD unless mentioned otherwise

Looking for reliable data on recent market performance? Here you’ll find a PDF document of the monthly statistics for the various Canadian, U.S. and international markets that we follow.

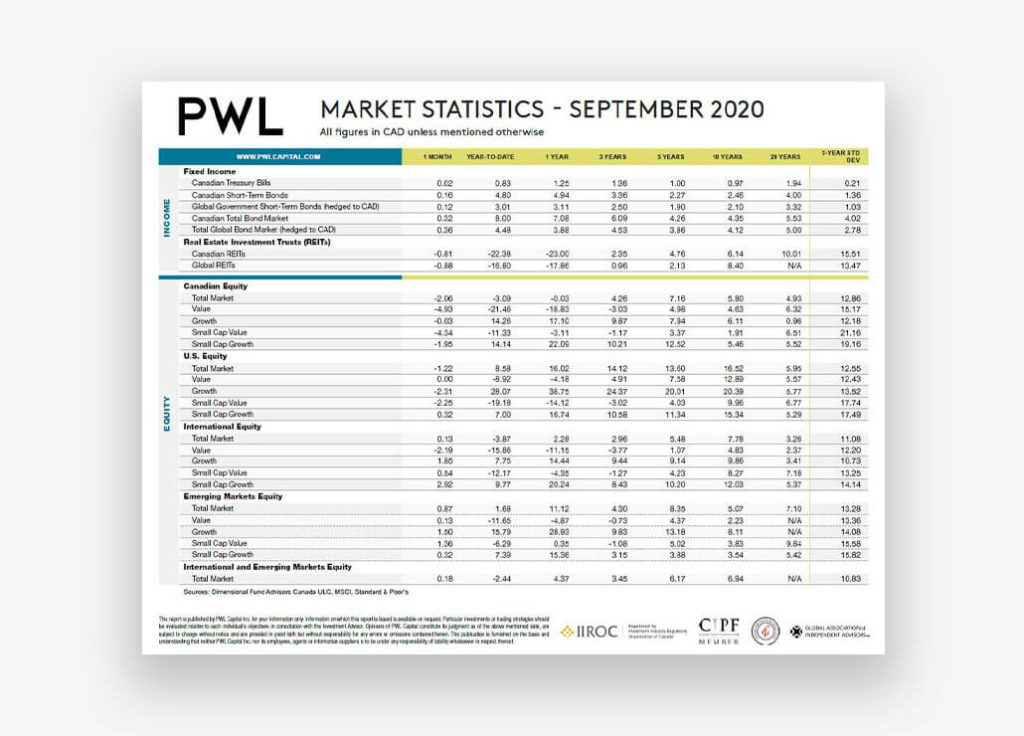
Sources: Dimensional Fund Advisors Canada ULC, MSCI, Standard & Poor’s
This report is published by PWL Capital Inc. for your information only. Information on which this report is based is available on request. Particular investments or trading strategies should be evaluated relative to each individual’s objectives in consultation with the Investment Advisor. Opinions of PWL Capital constitute its judgment as of the above mentioned date, are subject to change without notice and are provided in good faith but without responsibility for any errors or omissions contained herein. This publication is furnished on the basis and understanding that neither PWL Capital Inc. nor its employees, agents or information suppliers is to be under any responsibility of liability whatsoever in respect thereof.

Scroll right Income

  • Fixed Income
    -1 monthYear-to-date1 year3 years5 years10 years20 years5-year Std Dev
    Canadian Treasury Bills0.020.831.251.361.000.971.940.21
    Canadian Short-Term Bonds0.164.804.943.362.272.464.001.36
    Global Government Short-Term Bonds (hedged to CAD)0.123.013.112.501.902.103.321.03
    Canadian Total Bond Market0.328.007.086.094.264.355.534.02
    Total Global Bond Market (hedged to CAD)0.364.483.884.533.864.125.002.78
  • Real Estate Investment Trusts (REITs)
    -1 monthYear-to-date1 year3 years5 years10 years20 years5-year Std Dev
    Canadian REITs-0.81-22.38-23.002.354.766.1410.0115.51
    Global REITs-0.88-16.80-17.860.962.138.40N/A13.47

Scroll right Equity

  • Canadian Equity
    -1 monthYear-to-date1 year3 years5 years10 years20 years5-year Std Dev
    Total Market-2.06-3.09-0.034.267.165.804.9312.86
    Value-4.93-21.46-18.83-3.034.984.636.3215.17
    Growth-0.0314.2617.109.877.946.110.9612.18
    Small Cap Value-4.34-11.33-3.11-1.173.371.916.5121.16
    Small Cap Growth-1.9514.1422.0910.2112.525.465.5219.16
  • U.S. Equity
    -1 monthYear-to-date1 year3 years5 years10 years20 years5-year Std Dev
    Total Market-1.228.5816.0214.1213.6016.525.9512.55
    Value - -8.92-4.184.917.5812.895.5712.43
    Growth-2.3128.0738.7524.3720.0120.395.7713.52
    Small Cap Value-2.25-19.18-14.12-3.024.039.966.7717.74
    Small Cap Growth0.327.0016.7410.5811.3415.345.2917.49
  • International Equity
    -1 monthYear-to-date1 year3 years5 years10 years20 years5-year Std Dev
    Total Market0.13-3.872.282.965.487.783.2611.08
    Value-2.19-15.86-11.15-3.771.074.832.3712.20
    Growth1.857.7514.449.449.149.863.4110.73
    Small Cap Value0.54-12.17-4.35-1.274.238.277.1813.25
    Small Cap Growth2.929.7720.248.4310.2012.035.3714.14
  • Emerging Markets Equity
    -1 monthYear-to-date1 year3 years5 years10 years20 years5-year Std Dev
    Total Market0.871.6811.124.308.355.077.1013.28
    Value0.13-11.65-4.87-0.734.372.23N/A13.36
    Growth1.5015.7928.939.8313.188.11N/A14.08
    Small Cap Value1.36-6.290.35-1.085.023.839.8415.58
    Small Cap Growth0.327.3915.363.153.883.545.4215.82