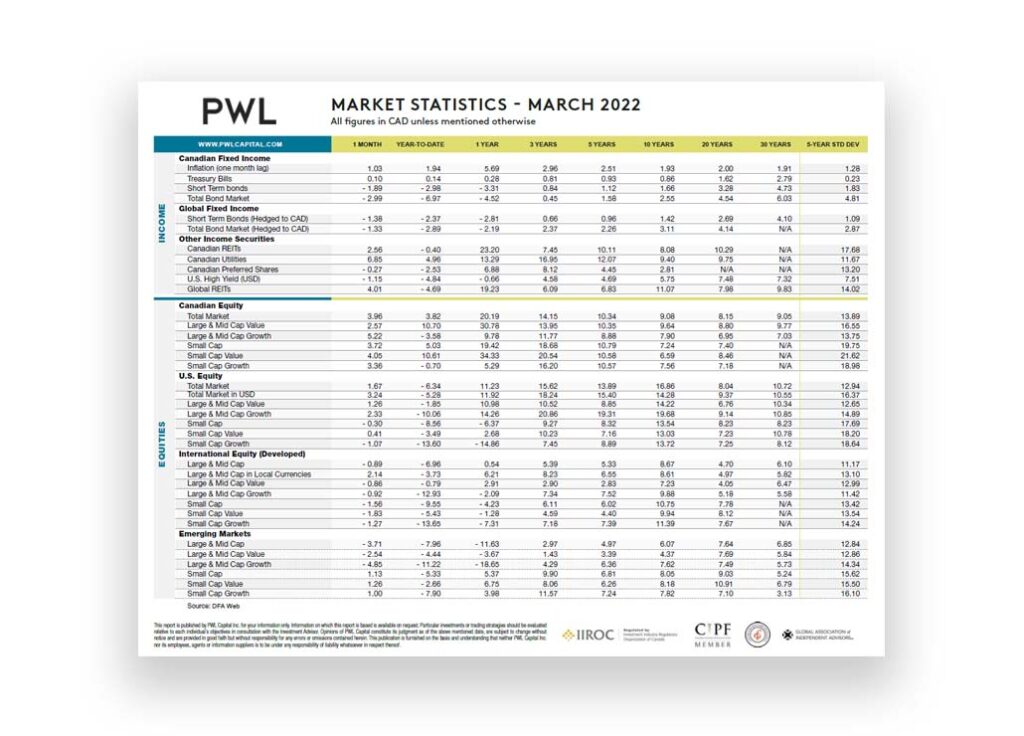
April 5, 2022 PWL Capital Market Statistics Market Statistics – Parkyn Doyon La Rochelle – March 2022 Published: April 5, 2022 All figures in CAD unless mentioned otherwise Looking for reliable data on recent market performance? Here you’ll find a PDF document of the monthly statistics for the various Canadian, U.S. and international markets that we follow. Source : DFA Web This report is published by PWL Capital Inc. for your information only. Information on which this report is based is available on request. Particular investments or trading strategies should be evaluated relative to each individual’s objectives in consultation with the Investment Advisor. Opinions of PWL Capital constitute its judgment as of the above mentioned date, are subject to change without notice and are provided in good faith but without responsibility for any errors or omissions contained herein. This publication is furnished on the basis and understanding that neither PWL Capital Inc. nor its employees, agents or information suppliers is to be under any responsibility of liability whatsoever in respect thereof. Download Market Statistics – Parkyn Doyon La Rochelle – March 2022 Scroll right Income Canadian Fixed Income -1 monthYear-to-date1 year3 years5 years10 years20 years30 years5-year Std Dev Inflation (one month lag)1.031.945.692.962.511.932.001.911.28 Treasury Bills0.100.140.280.810.930.861.622.790.23 Short Term bonds-1.89-2.98-3.310.841.121.663.284.731.83 Total Bond Market-2.99-6.97-4.520.451.582.554.546.034.81 Global Fixed Income -1 monthYear-to-date1 year3 years5 years10 years20 years30 years5-year Std Dev Short Term Bonds (Hedged to CAD)-1.38-2.37-2.810.660.961.422.694.101.09 Total Bond Market (Hedged to CAD)-1.33-2.89-2.192.372.263.114.14N/A2.87 Other Income Securities -1 monthYear-to-date1 year3 years5 years10 years20 years30 years5-year Std Dev Canadian REITs2.56-0.4023.207.4510.118.0810.29N/A17.68 Canadian Utilities6.854.9613.2916.9512.079.409.75N/A11.67 Canadian Preferred Shares-0.27-2.536.888.124.452.81N/AN/A13.20 U.S. High Yield (USD)-1.15-4.84-0.664.584.695.757.487.327.51 Global REITs4.01-4.6919.236.096.8311.077.989.8314.02 Scroll right Equities Canadian Equity -1 monthYear-to-date1 year3 years5 years10 years20 years30 years5-year Std Dev Total Market3.963.8220.1914.1510.349.088.159.0513.89 Large & Mid Cap Value2.5710.7030.7813.9510.359.648.809.7716.55 Large & Mid Cap Growth5.22-3.589.7811.778.887.906.957.0313.75 Small Cap3.725.0319.4218.6810.797.247.40N/A19.75 Small Cap Value4.0510.6134.3320.5410.586.598.46N/A21.62 Small Cap Growth3.36-0.705.2916.2010.577.567.18N/A18.98 U.S. Equity -1 monthYear-to-date1 year3 years5 years10 years20 years30 years5-year Std Dev Total Market1.67-6.3411.2315.6213.8916.868.0410.7212.94 Total Market in USD3.24-5.2811.9218.2415.4014.289.3710.5516.37 Large & Mid Cap Value1.26-1.8510.9810.528.8514.226.7610.3412.65 Large & Mid Cap Growth2.33-10.0614.2620.8619.3119.689.1410.8514.89 Small Cap-0.30-8.56-6.379.278.3213.548.238.2317.69 Small Cap Value0.41-3.492.6810.237.1613.037.2310.7818.20 Small Cap Growth-1.07-13.60-14.867.458.8913.727.258.1218.64 International Equity (Developed) -1 monthYear-to-date1 year3 years5 years10 years20 years30 years5-year Std Dev Large & Mid Cap-0.89-6.960.545.395.338.674.706.1011.17 Large & Mid Cap in Local Currencies2.14-3.736.218.236.558.614.975.8213.10 Large & Mid Cap Value-0.86-0.792.912.902.837.234.056.4712.99 Large & Mid Cap Growth-0.92-12.93-2.097.347.529.885.185.5811.42 Small Cap-1.56-9.55-4.236.116.0210.757.78N/A13.42 Small Cap Value-1.83-5.43-1.284.594.409.948.12N/A13.54 Small Cap Growth-1.27-13.65-7.317.187.3911.397.67N/A14.24 Emerging Markets -1 monthYear-to-date1 year3 years5 years10 years20 years30 years5-year Std Dev Large & Mid Cap-3.71-7.96-11.632.974.976.077.646.8512.84 Large & Mid Cap Value-2.54-4.44-3.671.433.394.377.695.8412.86 Large & Mid Cap Growth-4.85-11.22-18.654.296.367.627.495.7314.34 Small Cap1.13-5.335.379.906.818.059.035.2415.62 Small Cap Value1.26-2.666.758.066.268.1810.916.7915.50 Small Cap Growth1.00-7.903.9811.577.247.827.103.1316.10